Hints and Information
Rainfall Data
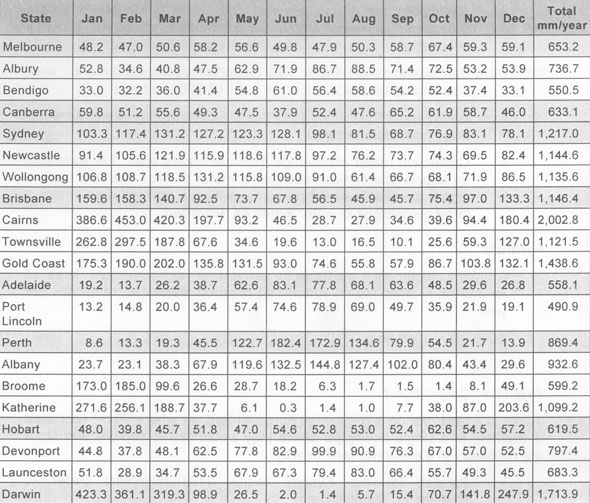
Australian Annual Rainfall Averages
Australian Average Rainfall (mm)
* Averaged over period of 1908 - 2004
Calculating Expected Annual Rainwater Catchment
There are a number of factors that need to be considered when calculating the expected annual rainwater catchment from a particular roof or other harvesting areas which will inturn help determine the size of the rainwater tank and the potential intended use.
- Rainfall for the region Rainfall data from Bureau of Meteorology, local rainfall stations, Council information.
- Catchment size Sq/m of specific roof catchment area discharging to tank.
- Pre-treatment Devices (first flush etc.) that may diver rainwater away from storage tank.
- Coefficient runnoff percentage from catchment area. For example, an impervious surface such as a metal or tiled roof will have a higher coefficient runoff percentage than a grassed area where a large percentage of water would be absorbed.
Formula
Annual x catchment x coefficient x percentage of = maximum litres of rainfall (mm) area (sq/m) runoff (%) diverted water (%) rainwater per year. 1000L = 1000kg
Example - Calculation 1:
There is a tiled roof on a residential house in Sydney where 70m2 roof area is draining to a single downpipe where whey would like to capture and store the roofwater in a rainwater tank nearby.
- Rainfall for the Sydney region (1217mm/year)
- Catchment size - Sq/m of specific roof catchment area discharging to tank (70m2)
- Coefficient runoff percentage from catchment area tiled roof, assume 90% coefficient rate for metal or tiled roofs.
- Pre-treatment devices - No device
Answer: 1217 x 70 x 0.90 = 76,671L per year of rainwater
Example - Calculation 2
There is a metal roof on a residential house in Perth where 200m2 roof area is draining to a four downpipes where they would like to capture and store the roofwater in an underground rainwater tank nearby, with a first lush device diverting 40L each time it rains.
- Rainfall for the Perth region (869mm/year)
- Catchment size - Sq/m of specific roof catchment area discharging to tank (200m2)
- Coefficient runoff percentage from catchment area tiled roof, assume 90% coefficient rate
- Pre-treatment devices 20L per rainfall event (assume 50 rainfall events - 2000L)
Answer: 869 x 200 x 0.90 - 2000L = 154,420L per year of rainwater
Average water consumption values for urban activities
Water usage volumes for certain activities around a domestic home can vary greatly depending on the number of residing within the home, the appliances and fixtures inside the home and the size and type of garden,
The figures below are only a guide to the average water consumption for certain activities around a domestic home. More accurate figures can be obtained from an individual water audit or investigating the individual consumption readings obtained from a water bill from your local water retailer.
Outdoor Water Use
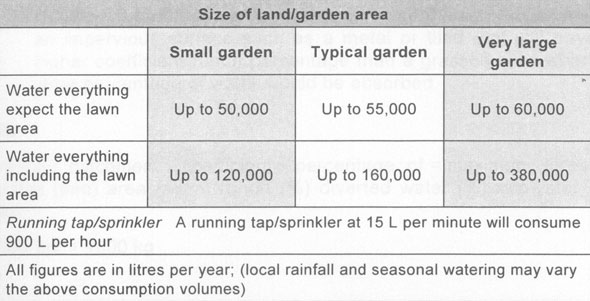
The above figures do not include outdoor washing, garden ponds or swimming pools.
Indoor Water Use
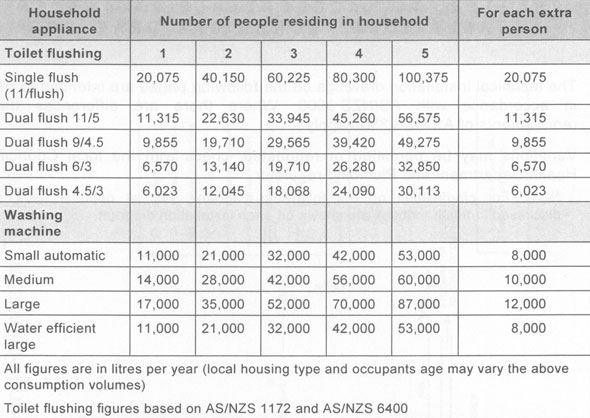
Average Household Water Consumption Percentages
The Average Australian Urban Household consumes between 230,000 - 280,000L of water per year.
Garden use - 35 - 50%
Bathroom - 10%
Hot water - 16%
Toilet flushing - 10 - 20%
Laundry - 10 - 20%
Kitchen - 5%
Reference:
HB 230 - 2006, Rainwater Tank Design and Installation Handbook, 1st Edition - January 2006
Common Pump Faults
- Pump stops & starts whilst tap open
Possible Cause - Incorrect air charge in pressure tank or hole in tank diaphragm.
What to do – Turn pump off at power point & open a cold tap to drain the water pressure from the system (it is important to leave the tap open), using a standard tyre gauge check the air pressure, for most common domestic pumps it should be 20psi (140kpa), for larger farm type pumps it should be 30psi (210kpa). If water comes out of the valve when testing air pressure it would normally mean the tank diaphragm has a hole in it & needs replacing. If no water comes out then you should proceed to pump it up, if the tank is water logged then you may notice water coming out of the tap you have open, this is ok. - Pump stops & starts with no taps open
Possible Cause – Non return valve or footvalve stuck partially open.
What to do – Turn pump off at power point & open a cold tap to drain the water pressure from the system. The non return or footvalve are normally located on the suction or inlet side of the pump, in some cases they are built into the pump, they stop pressurised water draining back into the tank when the pump switches off. They may have a stick or similar caught under the seat, the valves need to be removed and or inspected/cleaned. After removing & cleaning the valve you may need to re-prime the pump if the water level in the tank is lower than the pump inlet. - Pump doesn’t switch off
Possible Cause – Blocked pressure switch, impeller(s) or jet.
What to do – Firstly check to see if the water pressure is normal, if the water pressure seems to be ok it would point towards a blocked water inlet on the pressure switch. If the water pressure seems low it would point towards an internal problem with the pump. Repair or replacement of these items are better carried out by qualified personal due to electrical hazard and or the need for replacement parts.
Other Things to Remember
Are there any filters in the system that may be restricting flow into or from the pump, ensure there is enough water in the tank. If the pump is variable speed or has an electronic controller fitted you may need to contact us for service.
Friction Loss
Friction loss is an important calculation to be considered when designing a new water system or installing a replacement pump on an existing system. It can be caused by trying to force high flow rates through small pipes and or the inclusion of valves & filters etc. By providing us with the flow rates you require and length & size of existing pipework we can do the calculation to be sure the correct pipe & pump size are used.
Suction Lift
Pumps don’t actually suck, rather they create a partial vacuum into which atmospheric pressure pushes water via the suction pipework. There are a number of factors which affect suction lift eg, height above sea level, pump suction performance, water temperature & friction loss. In practical terms a maximum suction lift of 6.7mt at sea level is common but all of the above factors will reduce this figure. Higher suction lifts may be achieved by use of deep well pumps.
Average rates of daily water intake by livestock
| Stock | Litres/animal/day |
| Sheep: | |
| nursing ewes on dry feed | 10 |
| fat lambs on dry pasture | 3 |
| mature sheep on dry pasture | 7 |
| fat lambs on irrigated pasture | 2 |
| mature sheep on irrigated pasture | 4 |
| Cattle: | |
| dry dairy cows | 100 |
| lactating dairy cows | 170 |
| beef cattle | 100 |
| calves | 30 |
| Horses: | |
| working | 60 |
| grazing | 40 |
| Pigs: | |
| brood sows | 30 |
| mature pigs | 15 |
| Poultry: | |
| laying hens | 0.5 |
| pullets | 0.2 |
| turkeys | 0.6 |
- All figures are estimates
- On extremely hot days animals water intake can increase by up to 80%
- The following formula can be used to help estimate daily water intake of dairy cows
- Dry matter intake per day in kilograms x 6
- Plus 1 litre of water per litre of milk produced daily
- Plus additional allowances for extreme weather ( + 35oC )
Water use for animal enterprises per day
| Dairies & Piggeries | 15 per sq m |
| Sheep Dip | 4.5 per sheep |
| Plunge Dip | 7 per sheep |
Flow Conversion |
||||
| Imperial | ||||
| lpm | lps | m3/hr | gpm | gph |
| 7.6 | 0.13 | 0.45 | 1.7 | 100 |
| 10 | 0.17 | 0.60 | 2.2 | 132 |
| 16.7 | 0.28 | 1 | 3.7 | 220 |
| 45.5 | 0.76 | 2.73 | 10 | 601 |
| 60.0 | 1 | 3.60 | 13.2 | 793 |
| 75.7 | 1.26 | 4.54 | 16.7 | 1000 |
| 83.3 | 1.39 | 5.00 | 18.3 | 1101 |
Pressure / Head Conversion |
||||
| Metres | kPa | Bar | Feet Head | PSI |
| 1 | 9.81 | 0.10 | 3.28 | 1.42 |
| 10 | 98.1 | 0.98 | 32.8 | 14.2 |
| 10.2 | 100 | 1 | 33.4 | 14.5 |
| 15.2 | 149.5 | 1.5 | 50.0 | 21.6 |
| 30.5 | 299.0 | 3.0 | 100 | 43.3 |
| 35.2 | 354.4 | 3.5 | 115.5 | 50 |
| 70.4 | 690.8 | 6.9 | 231.0 | 100 |
| 101.9 | 999.6 | 10.0 | 334.2 | 144.7 |
Volume Conversion |
||||
| Litres | Cubic Metres | Imp. Gals | US Gals | Cubic Feet |
| 1 | 0.001 | 0.22 | 0.264 | 0.0353 |
| 1000 | 1 | 220 | 264 | 35.3 |
| 4.546 | 0.0045 | 1 | 1.2 | 0.1605 |
| 3.785 | 0.0038 | 0.833 | 1 | 0.1337 |
| 28.32 | 0.0283 | 6.23 | 7.48 | 1 |
Length Conversion |
|||
| Inch | Foot | Yard | Metres |
| 1 | 0.08 | 0.028 | 0.025 |
| 12.0 | 1 | 0.33 | 0.305 |
| 36.0 | 3.00 | 1 | 0.91 |
| 39.4 | 3.28 | 1.09 | 1 |